The lead enterprise architect of a European distribution company joins a design review for a new AI assistant that helps accounts payable resolve invoice exceptions. Halfway through the slides she recognises the diagram. It is the third connector to the same finance module of the ERP system this year, each built by a different team, each with its own copy of supplier data and its own vendor contract. None of the three projects knew about the others, because none of them had ever been placed on the same map.
This is where AI strategy quietly loses money. The ideas are good, the business cases are approved, and the waste happens underneath, in duplicated integrations, data pipelines and licences that nobody planned for. The missing link is usually enterprise architecture. This article follows the money. It starts with why AI and enterprise architecture so often run on separate tracks, then shows where AI ideas cluster on the capability map according to the MetroMinds Library, and closes with a capability view that brings the two together.
Why AI and enterprise architecture run on separate tracks
In most organisations, AI initiatives start in the business. A team sees a problem, finds a tool or a partner, writes a business case and gets a budget. Enterprise architecture comes in later, if at all, to check security and integration once the choice has been made. By then the architect can only review, not shape.
Architects feel this too. Gartner's priorities for heads of enterprise architecture warn that "Enterprise architecture is at risk of losing relevance as stakeholders demand direct business value", and advise a shift "from architecture-centric metrics to business-outcome-driven value" [1]. AI makes that tension sharper. Business leaders talk about use cases and benefits; architects talk about applications, data and integration. Without a shared language, the two conversations rarely meet.
That shared language already exists in most architecture teams: the map. As William Ulrich puts it, "A business capability defines 'what' a business does at its core. This differs from 'how' things are done or where they are done." [2]. A capability is stable even when processes, systems and organisation charts change, which is exactly what you need when AI ideas arrive from every direction.
Where AI ideas cluster on the capability map
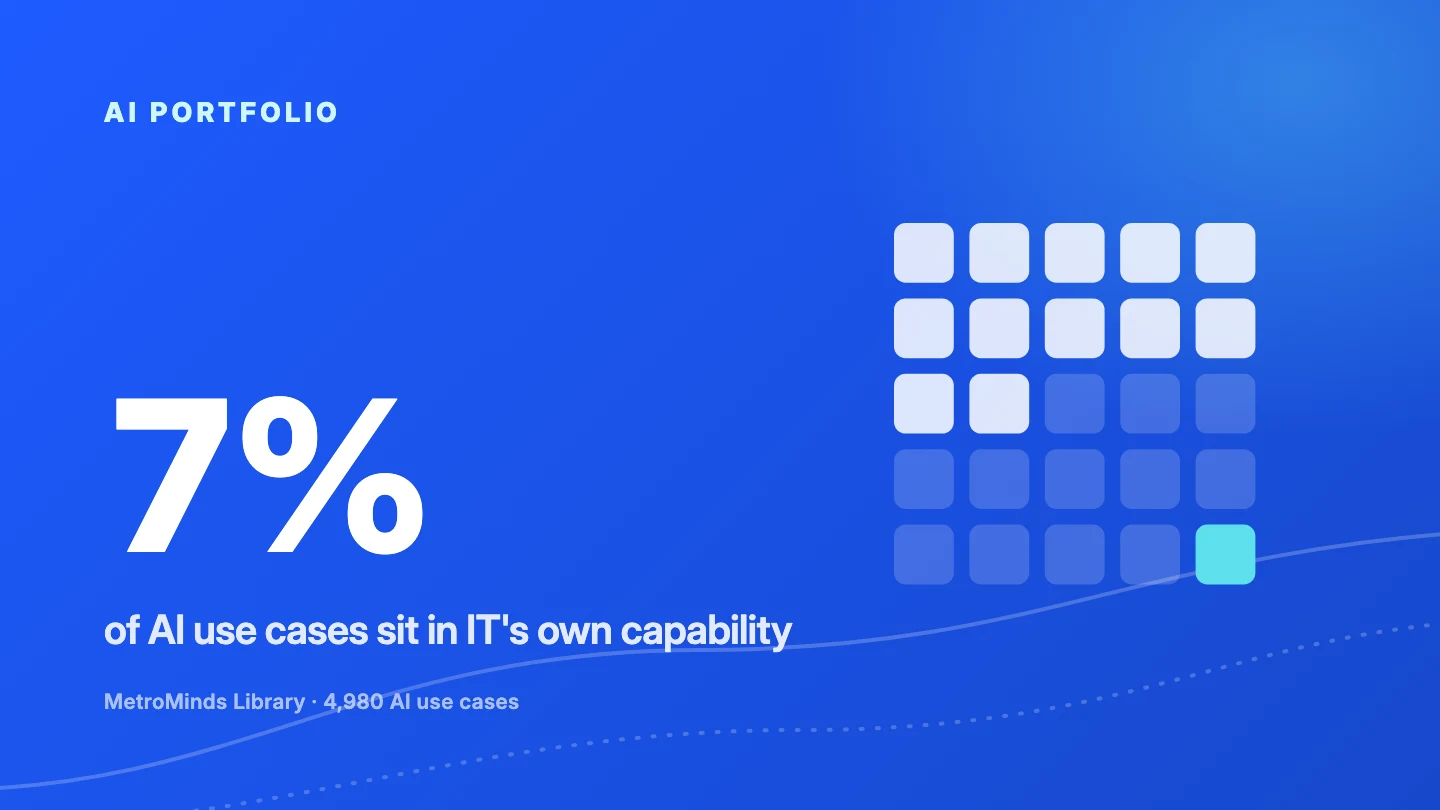
Every use case in the MetroMinds Library is linked to a capability at three levels. Across the 4,980 use cases, that adds up to 12 top-level capabilities, 57 at the second level and 209 at the third. When you draw them as a map, the uneven spread is striking.

Operations and Delivery is the largest block by far, and within it a single L2 capability, Service Fulfillment, holds 813 use cases on its own. Asset and facilities management, operational planning and quality assurance follow. Strategy and leadership, transformation and legal are much smaller blocks. For an architect, this is useful before any single project arrives: it shows which parts of the application portfolio will be asked to support AI first.
The concentration becomes even clearer at the third level.

The ten busiest L3 capabilities hold 29 percent of all use cases. The top 20 hold 43 percent, and the top 50 hold two thirds. At the other end, 55 capabilities have five use cases or fewer. In practical terms, a relatively small part of your capability map will carry most of your AI portfolio, and the systems behind those capabilities will be touched again and again.
Where the money leaks
When several AI initiatives land on the same capability without anyone noticing, the cost shows up in the architecture rather than in the business case. Each team builds its own connection to the same core system, extracts its own copy of the same master data and negotiates its own contract with a vendor that may already be in use elsewhere. Every individual project looks reasonable. The total does not.
There is a quieter cost as well. When three tools write recommendations based on three slightly different copies of supplier data, their outputs start to disagree. Users lose trust, and somebody has to reconcile the differences by hand, which eats into the very savings the business cases promised.
Take procurement operations as an example. The Library holds 38 use cases for this one capability, from ten different . Eighteen of them are cross-industry, and eight of those deal with invoices, exceptions or the payment run. They range from an agent that works match exceptions overnight to a conversational assistant that answers purchase status questions. Without a capability view, those could easily become eight separate projects, each with its own path into the same ERP finance module.
How to bring architecture into the AI portfolio
None of this requires a new framework. It requires the capability map to sit at the front of the AI process rather than at the end. A few practical steps make the difference:
- Ask every AI idea to name the L3 capability it supports when it is first registered, not when it reaches design review.
- Review the portfolio per capability every quarter, and flag capabilities where three or more initiatives are active or planned.
- For those busy capabilities, define the shared data, integration and access patterns before the next project starts.
- Include a share of the shared foundation in each business case, so that the cost is visible and fairly spread.
- Use the capability view in conversations with business leaders, who recognise their capabilities far more easily than application names.
For the CIO, this capability view also explains why so much of the AI portfolio ends up in operations, a pattern we explore in Why your AI portfolio is mostly an operations portfolio.
How MetroMinds connects AI ideas to your capability map
In MetroMinds, every use case is linked to a business capability from L1 to L3, using a modern enterprise capability model. When teams add use cases to the portfolio, you can see straight away which capabilities they touch and where initiatives cluster. The capability impact view shows the same portfolio from the architect's side: which parts of the organisation change, and how strongly.
Because the Library covers 209 L3 capabilities, you can also look ahead. Before a team proposes its next idea, you can see which other AI use cases exist for the same capability and plan the foundation they will share.
Want to see your AI portfolio on a capability map? Book a demo
Sources
- Gartner, "Top 3 Priorities for Heads of Enterprise Architecture", Leadership Vision for 2026.
- William Ulrich, "Defining the Business Capability: A Cheat Sheet", BPM Institute, undated.
- MetroMinds Library, 4,980 AI use cases with benchmark ranges based on real-world implementations, August 2026.